Introduction
Machine learning has become an indispensable tool in today’s data-driven world, transforming the way we extract insights from data. However, it’s not immune to challenges, and one of the most perplexing issues that often surface is the presence of outliers and spurious vectors. These anomalies can wreak havoc on the performance of machine learning models, leading to inaccurate predictions and unreliable insights. In this blog post, we will explore what outliers and spurious vectors are, their impact on machine learning, and strategies to handle them effectively.
Outliers: The Odd Ones Out
Outliers are data points that deviate significantly from the majority of the data in a dataset. They can be caused by various factors such as measurement errors, data entry mistakes, or genuine anomalies in the data. Outliers can distort the statistical properties of a dataset, leading to biased model training and prediction.
Impact of Outliers in Machine Learning:
- Model Sensitivity: Outliers can significantly influence the parameters of machine learning models. Many algorithms, such as linear regression, are sensitive to outliers, leading to skewed coefficients and suboptimal predictions.
- Reduced Generalization: Outliers can hinder a model’s ability to generalize patterns, as they may be treated as important patterns themselves. This can result in poor model performance on unseen data.
- Increased Error: Outliers can increase the overall error of a model, as they contribute disproportionately to the loss function. This can lead to subpar model performance and unreliable results.
Strategies to Handle Outliers:
- Detection: Identify and visualize outliers using statistical methods (e.g., Z-scores or IQR) or visualization tools (e.g., box plots or scatter plots). Understanding the nature of outliers is crucial before deciding on a strategy.
- Data Cleaning: One approach is to remove outliers from the dataset if they are the result of data entry errors or measurement issues. However, this should be done cautiously, as removing too many outliers can lead to data loss and bias.
- Robust Models: Use robust machine learning algorithms like random forests, which are less sensitive to outliers. These models can handle noisy data more effectively.
- Data Transformation: Transform the data using techniques like log transformation or robust scaling to reduce the influence of outliers on the model while preserving valuable information.
Spurious Vectors: Misleading Patterns
Spurious vectors, also known as ghost or noise features, are variables in a dataset that appear to contain meaningful information but are, in fact, irrelevant or random. These vectors can mislead machine learning models by introducing noise and overfitting.
Impact of Spurious Vectors on Machine Learning:
- Overfitting: Models can overfit to spurious vectors, capturing noise instead of genuine patterns in the data. This results in poor generalization to new data.
- Increased Dimensionality: Spurious vectors can inflate the dimensionality of the feature space, making it computationally expensive and leading to the curse of dimensionality.
- Decreased Model Interpretability: When models are trained on datasets with spurious vectors, it becomes challenging to interpret the importance of individual features in making predictions.
Strategies to Handle Spurious Vectors:
- Feature Selection: Employ feature selection techniques like recursive feature elimination or L1 regularization to identify and remove spurious vectors.
- Domain Knowledge: Leverage domain knowledge to identify and eliminate variables that are known to be irrelevant to the problem at hand.
- Cross-Validation: Use cross-validation to evaluate model performance and ensure that it generalizes well to new data, even in the presence of spurious vectors.
Certainly! I’ll provide you with some Jupyter Notebook code examples for detecting outliers and handling spurious vectors using Python and popular libraries like NumPy and Scikit-Learn.
Code examples for detecting outliers and handling spurious vectors using Python and popular libraries like NumPy and Scikit-Learn.
Outliers Detection and Handling:
1. Z-Score Method for Outliers Detection:
import numpy as np
from scipy import stats

# Generate some example data
data = np.random.randn(100)

# Calculate Z-scores for the data
z_scores = np.abs(stats.zscore(data))

# Define a threshold for identifying outliers
threshold = 2.5

# Find the indices of outliers
outlier_indices = np.where(z_scores > threshold)

# Remove outliers from the data
data_no_outliers = data[z_scores <= threshold]

print("Original Data:", data)
print("Outliers:", data[outlier_indices])
print("Data without Outliers:", data_no_outliers)
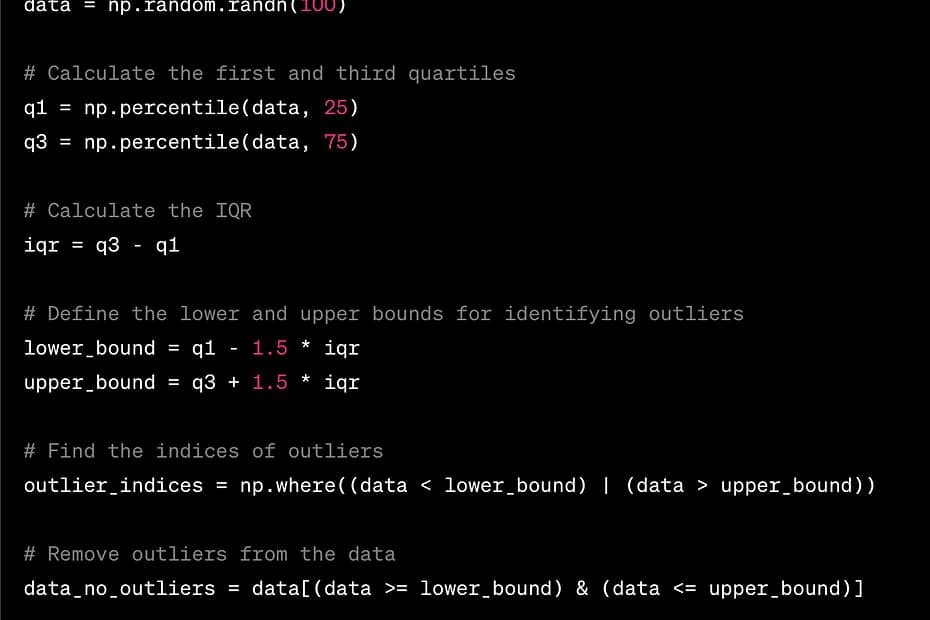
2. Interquartile Range (IQR) Method for Outliers Detection:
import numpy as np

# Generate some example data
data = np.random.randn(100)

# Calculate the first and third quartiles
q1 = np.percentile(data, 25)
q3 = np.percentile(data, 75)

# Calculate the IQR
iqr = q3 - q1

# Define the lower and upper bounds for identifying outliers
lower_bound = q1 - 1.5 * iqr
upper_bound = q3 + 1.5 * iqr

# Find the indices of outliers
outlier_indices = np.where((data < lower_bound) | (data > upper_bound))

# Remove outliers from the data
data_no_outliers = data[(data >= lower_bound) & (data <= upper_bound)]

print("Original Data:", data)
print("Outliers:", data[outlier_indices])
print("Data without Outliers:", data_no_outliers)
Spurious Vectors Detection and Handling:
1. Using Feature Selection with Scikit-Learn:
from sklearn.datasets import load_iris
from sklearn.feature_selection import SelectKBest, f_classif

# Load the Iris dataset as an example
iris = load_iris()
X, y = iris.data, iris.target

# Select the top k features using ANOVA F-statistic
k = 2
selector = SelectKBest(score_func=f_classif, k=k)
X_new = selector.fit_transform(X, y)

print("Original Features:", X.shape[1])
print("Selected Features:", k)
print("Selected Features Indices:", selector.get_support(indices=True))
2. Using Domain Knowledge to Remove Spurious Features:
import pandas as pd

# Create a DataFrame with spurious features
data = pd.DataFrame({
    'feature1': [1, 2, 3, 4, 5],
    'feature2': [5, 4, 3, 2, 1],
    'spurious_feature': [0, 0, 0, 0, 0]
})

# Remove spurious feature based on domain knowledge
data = data.drop(columns=['spurious_feature'])

print("Data After Removing Spurious Feature:")
print(data)
These examples showcase how to detect and handle outliers using the Z-score and IQR methods and how to identify and remove spurious features using feature selection and domain knowledge. You can adapt these code snippets to your specific datasets and use cases in Jupyter Notebook to address outliers and spurious vectors effectively.
Conclusion
Outliers and spurious vectors can be major stumbling blocks in the pursuit of accurate and reliable machine-learning models. Understanding their impact and employing appropriate strategies for detection and mitigation is essential for building robust models. Remember that there is no one-size-fits-all solution, and handling these issues often requires a combination of data preprocessing, feature engineering, and model selection techniques. By addressing outliers and spurious vectors effectively, machine learning practitioners can unlock the true potential of their data and build models that provide meaningful insights.